
GeoPS:a Geo - Phase equilibria Simulator
A high-performance visualization program for phase equilibria modeling based on Gibbs free energy minimization method.
To make phase equilibria modeling is accessible to anyone in need
It requires Windows x64 OS with .net framework 4.5 or later
The soft is free for non-commercial purposes and may be used only at the user‘s responsibility.
How to cite: Xiang, H., & Connolly, J. A. D. (2021). GeoPS: An interactive visual computing tool for thermodynamic modelling of phase equilibria. Journal of Metamorphic Geology,1–13. https://doi.org/10.1111/jmg.12626
It is time to expect more
World-class performance with more facility, more productivity, and more value while you simulate phase equilibria
A user-friendly visual computing tool, what you wee is what you get.
With much higher efficiency,you can get results while you wait.
GeoPS provides a wide range of phase equilibria calculations and illustration facilities base on Gibbs free energy minimization method, which are done automatically with practically no user intervention. The applications include calculation various type of phase diagrams, isopleths, and thermodynamic modelling for path-dependent open system processes, such as fluid and melt loss, and chemical fractionation during compositionally zoned minerals growth in a metamorphic process.
READ MORE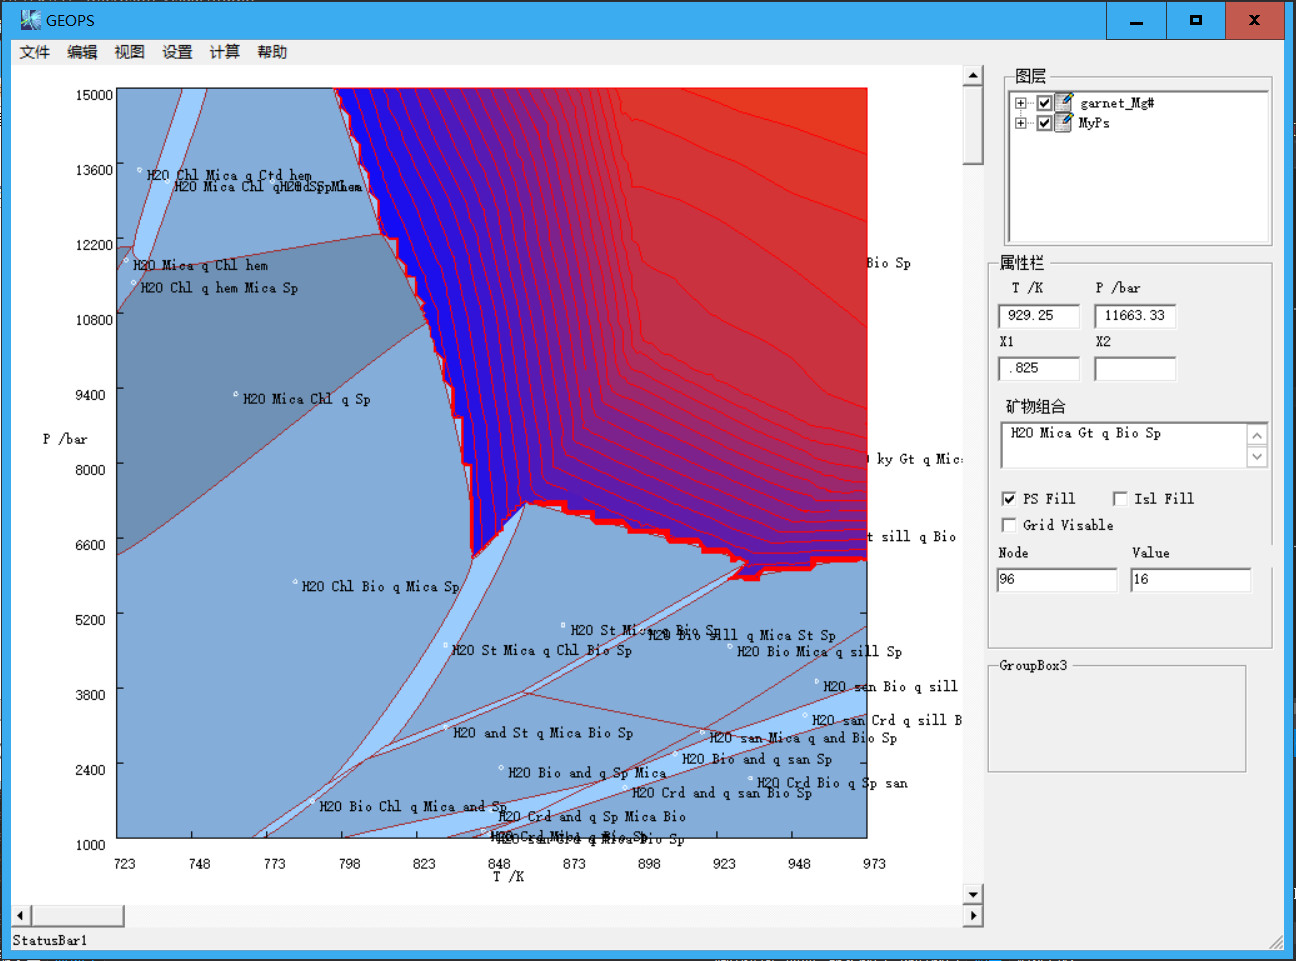
Why GeoPS?

EASY To Use
The calculations are done automatically with practically no user intervention. During calculating the phase diagram, it is only necessary to input bulk compositions and the P-T range. For senior users, also are allowed to change various parameters to achieve personalized calculation.

RELIABLE Results
If using the same thermodynamic dataset and Solution models, the phase diagrams calculated by GeoPS are consistent with that calculated by THERMOCALC

HIGH Efficiency
In a few minutes, it can finish a phase diagram calculation in a complex system. The well-designed architecture, algorithm and multi-threading parallel computing create extraordinary computing efficiency. Compared with the other related software, its speed is much faster.

VISUALIZATION Computing
Through the visualization of the computing process, the preliminary results will be timely displayed on the soft interface during computing. Hence, the user is allowed to see and deal with the preliminary results, acquaint the progress of the calculation and also can stop the calculation if required.

ONE-STOP Solution
Seamless integration of full functions, including creating task, computing, calculating isopleths, visualization of calculated results, graph display and modification, interactive data display, etc. It is an important goal to provide highly efficient and smooth user experience and make the user enjoy thermodynamic simulation.

OUTPUT To Multiple Formats
GeoPS can create high-quality and ready-to-use vector graphics (SVG format), and also can output bitmap formats figures, such as JPEG and BMP. The calculated results, including assemblages, mode and compositions of phases, etc., can be output in CSV format which can be analyzed directly in excel.
Quick start
users
some description